Skip to main content
Accessibility
Google Tag Manager
Search SPLC
Donate
Menu
About
Endorsements
Our Work
Exposing Extremism in Elections
About
The Data
Guide to the Data
Who They Are
Voting Information
Submit a Tip
Federal Policy Advocacy
Cross-Cutting
Eradicating Poverty
Decriminalization & Decarceration
Hate & Extremism
Voting Rights
International Advocacy
Decarceration and Decriminalization
Protecting Democracy
Protecting Voting Rights
Eradicating Poverty
Other Issues
News
Join Us
Donate
Home
Facebook
Twitter
Search splcenter.org
Search
Figure 3.png
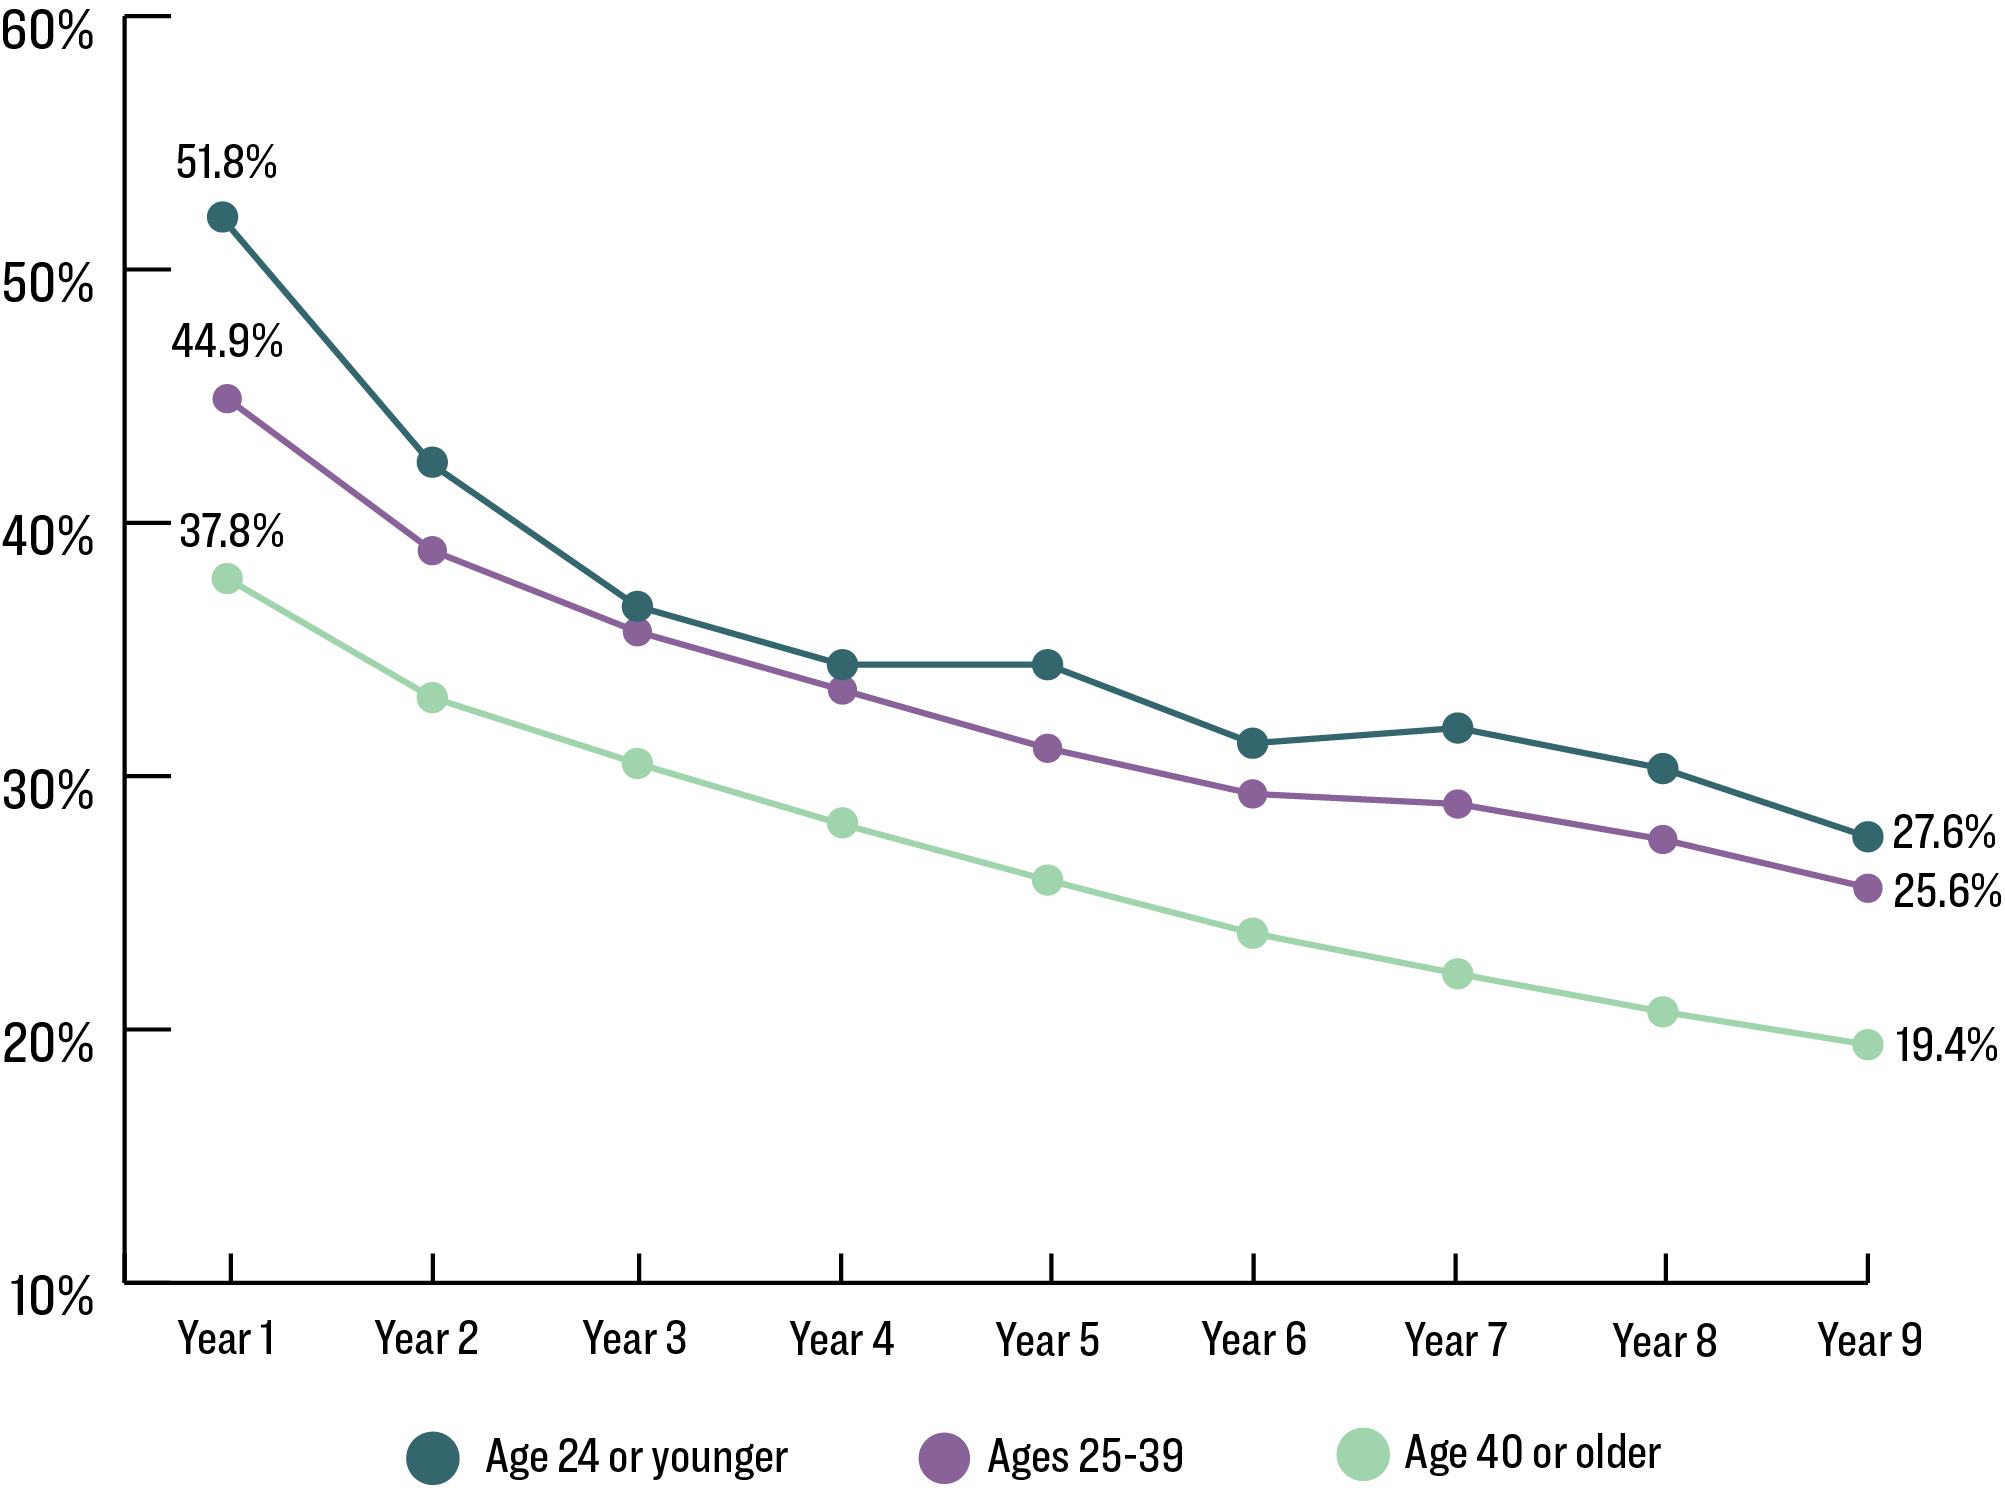
Figure 3: Re-arrest Rates Each Year After Prison Release by Age Group Source: U.S. Bureau of Justice Statistics, 2018
Email Address
*
Close Newsletter Prompt